
Localization teams face a perennial challenge: the investment is concrete, but the return is diffuse. You know localization is working when international traffic grows, conversion rates improve, and new market revenue scales. But attributing those outcomes specifically to localization (rather than to general marketing or product improvements) is genuinely difficult.
This guide gives you a complete framework: which metrics to track, how to calculate ROI, how to set up an attribution model that holds up to executive scrutiny, and what a localization ROI dashboard looks like in practice.
If you are still building the business case, the complete guide to website localization covers the strategic context before you get to measurement.
1. Why Localization ROI Is Hard to Measure
Before diving into the framework, it is worth acknowledging why localization ROI measurement is genuinely difficult:
• Multi-factor attribution: When revenue grows in Germany after you launch a localized German site, how much is attributable to localization vs. concurrent paid media, pricing changes, or product improvements? The answer requires controlled measurement.
• Long time horizons: Localization ROI often takes 3-12 months to materialize fully. Traffic builds organically. Brand trust builds over time.
• Indirect benefits: Some of localization highest-value impacts — reduced support costs, increased NPS, stronger brand perception — do not show up in direct revenue metrics.
• Baseline data gaps: If you did not measure traffic, conversion rates, and revenue in a market before localization, you have no baseline to compare against.
The solution is systematic: set up measurement infrastructure before launching localization, and track consistently over a 6-12 month horizon.
2. The Localization ROI Formula
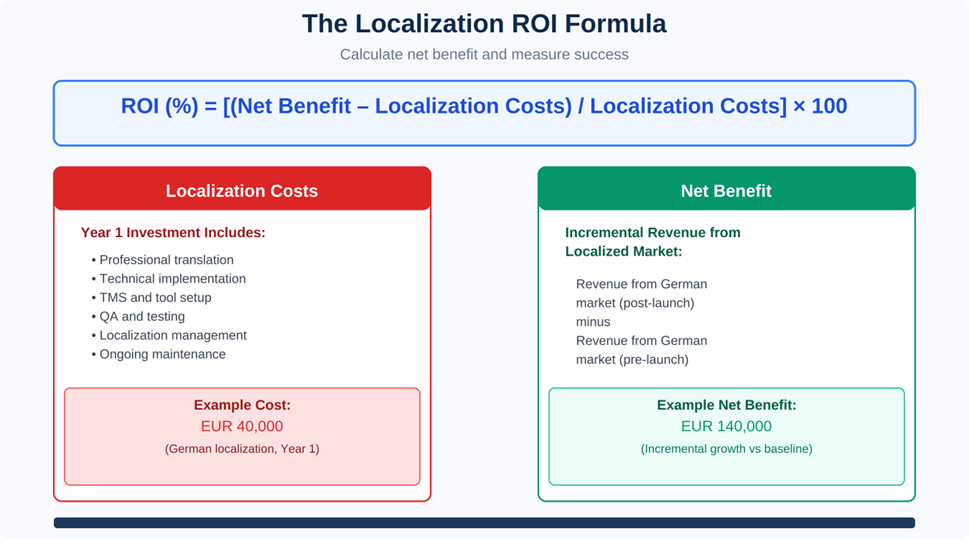
Figure 1: Calculate ROI by comparing incremental revenue against total localization costs.
At its simplest, the localization ROI formula is:
| ROI (%) = [(Net Benefit minus Localization Costs) / Localization Costs] times 100 |
Where:
Net Benefit = Incremental revenue generated from the localized market compared to baseline
Localization Costs = All-in costs including translation, technical implementation, tools and TMS platforms, QA and testing, ongoing maintenance
Example:
• Total localization investment (Year 1): EUR 40,000
• Incremental revenue from the German market vs. pre-localization baseline: EUR 180,000
• Net benefit: EUR 140,000
• ROI = (EUR 140,000 / EUR 40,000) times 100 = 350%
This calculation works best when you have a clear baseline and can isolate the localization impact from other variables. The more accurate your attribution model, the more credible your ROI figure.
3. Setting Up Measurement Before You Launch
The single most important step in localization ROI measurement happens before localization goes live: capturing your baseline. Without baseline data, you are measuring a delta against an unknown starting point.
Set up these baseline measurements before launch:
| Metric | Where to Measure | Baseline Period |
| Monthly sessions from target market | GA4 Audience > Geo | 3 months pre-launch |
| Conversion rate from target market | GA4 Conversions by country | 3 months pre-launch |
| Revenue per session (target market) | GA4 plus e-commerce data | 3 months pre-launch |
| Organic keyword rankings | Semrush / Ahrefs with country filter | At launch date |
| Bounce rate from target market | GA4 segmented by country | 3 months pre-launch |
| Avg session duration | GA4 segmented by country | 3 months pre-launch |
4. The Localization KPI Framework
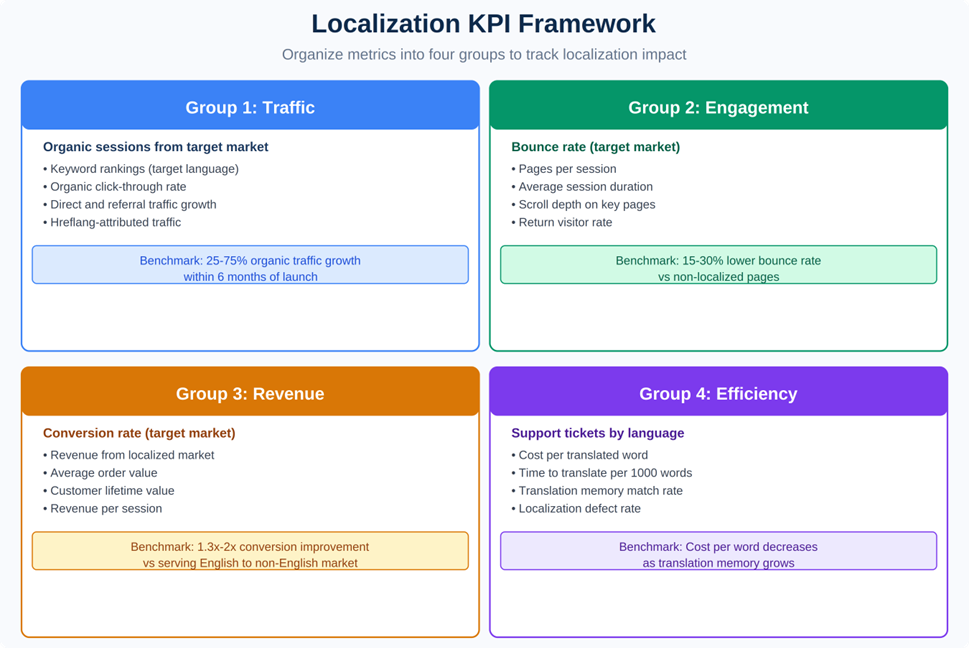
Figure 2: Organize KPIs into four groups to track all dimensions of localization impact.
Organize your KPIs into four groups to track localization comprehensively:
Group 1: Traffic Metrics
These show whether localization is generating awareness and organic discovery. Benchmark: well-executed localization typically drives 25-75% organic traffic growth from a target market within 6 months.
• Organic sessions from target market: Volume of organic search traffic from the localized market
• Keyword rankings (target language): Position for priority keywords in local search
• Organic click-through rate: Whether localized meta titles and descriptions attract clicks
• Direct and referral traffic from market: Brand awareness and offline-driven growth
Group 2: Engagement Metrics
These show whether localized content resonates with the target audience. Benchmark: fully localized sites typically show bounce rates 15-30% lower than non-localized pages served to the same audience.
• Bounce rate: Whether users stay on landing on localized content
• Pages per session: Depth of engagement with localized content
• Average session duration: Quality of content resonance
• Return visitor rate: Whether users come back to the localized version
Group 3: Revenue Metrics
These show whether localization is converting into business outcomes. Benchmark: successful localization typically delivers 1.3x-2x improvement in conversion rate compared to serving English content to a non-English market.
• Conversion rate (target market): Percentage of visitors completing desired action
• Revenue from localized market: Total revenue attributable to the localized version
• Average order value: Value per transaction in the market
• Customer lifetime value: Long-term revenue per acquired customer
• Revenue per session: Efficiency of traffic monetization
Group 4: Efficiency Metrics
These show the operational impact of localization. Benchmark: cost per translated word typically decreases as translation memory grows and processes mature. Tracking this alongside the right localization partner makes the efficiency case to finance.
• Support tickets by language: Whether localization reduces support load
• Cost per translated word: Whether translation memory is reducing unit cost
• Translation memory match rate: How much existing TM is reused in new content
• Localization defect rate: Quality of localization output post-launch
5. Attribution Models for Localization
Attribution is the hard part. Here are three approaches in order of sophistication:
Model 1: Before/After Comparison (Simple)
Compare performance in the target market before and after localization launch. Segment GA4 data by country. Compare conversion rate, revenue, and traffic from the target market for 3 months before vs. 3 months after launch.
Best for: Quick directional assessment; stakeholder presentations that do not require precision. Limitation: does not control for seasonal effects or concurrent marketing spend.
Model 2: Localized vs. Non-Localized Holdout (Controlled)
Run a controlled experiment where a percentage of users in the target market are served the non-localized (English) version as a control group. Use A/B testing or geo-targeted segmentation to serve the localized version to 80% and English to 20%.
Best for: High-traffic markets where precision justifies the experimental setup. Limitation: requires significant traffic volume and may create negative user experience for control group.
Model 3: Multi-Touch Attribution with Localization as a Dimension
Tag all interactions with localized content in your analytics platform and track which content interactions precede conversions. Use UTM parameters or data layer events to tag sessions that include localized content.
Best for: Mature analytics teams at companies with significant international investment. Limitation: complex setup; requires marketing analytics sophistication.
6. Building a Localization ROI Report for Stakeholders
A stakeholder-ready ROI report should include:
(1) Executive Summary: total investment, total incremental revenue, ROI percentage, top wins and challenges.
(2) Traffic Impact: organic growth by market with trend.
(3) Conversion Impact: before/after conversion rate comparison.
(4) Revenue Attribution: revenue from localized markets vs. baseline.
(5) Efficiency Metrics: cost per word trend and support ticket reduction.
(6) Forward Projection: estimated ROI if current trajectory continues and recommended budget for next phase.
7. Localization ROI Benchmarks
Based on industry data across published case studies. For SaaS businesses the picture looks different (see SaaS localization ROI patterns) but across e-commerce and B2B, the full cost picture helps set realistic return expectations:
| Metric | Typical Range |
| Conversion rate improvement (localized vs. English) | 30% – 200% |
| Organic traffic growth (6 months post-launch) | 25% – 75% |
| Time to positive ROI | 2 – 8 months |
| Year-2 ROI (with TM savings) | 300% – 600% |
| Companies reporting positive ROI | 96% |
8. FAQ
How long before localization investment pays back?
For markets with existing organic traffic that is not converting due to language barriers, payback can be as fast as 2-3 months. For markets where localization is driving new organic discovery from scratch, 6-12 months is more typical.
What if we cannot separate localization ROI from other activities?
Use the simplest attribution model you can justify and be transparent about limitations. Stakeholders who understand that localization is one of multiple factors will accept a directional ROI case.
Should we measure ROI per language or per market?
Per market where possible. Market conditions vary within a language. Brazilian and European Portuguese speakers are in different markets with different economics. Market-level measurement gives more actionable data.
Related Articles
This article is part of the website localization content cluster covering strategy, implementation, cost, and measurement.